Covid 19 Data Analysis
Interactive Visualizations can reveal a lot about trends and patterns in spatiotemporal data. In this Open Source project the visualizations are created using COVID19 data. The link to COVID19 visualizations is given below. These visualizations are best viewed using Chrome on Tablet or Desktop screens.
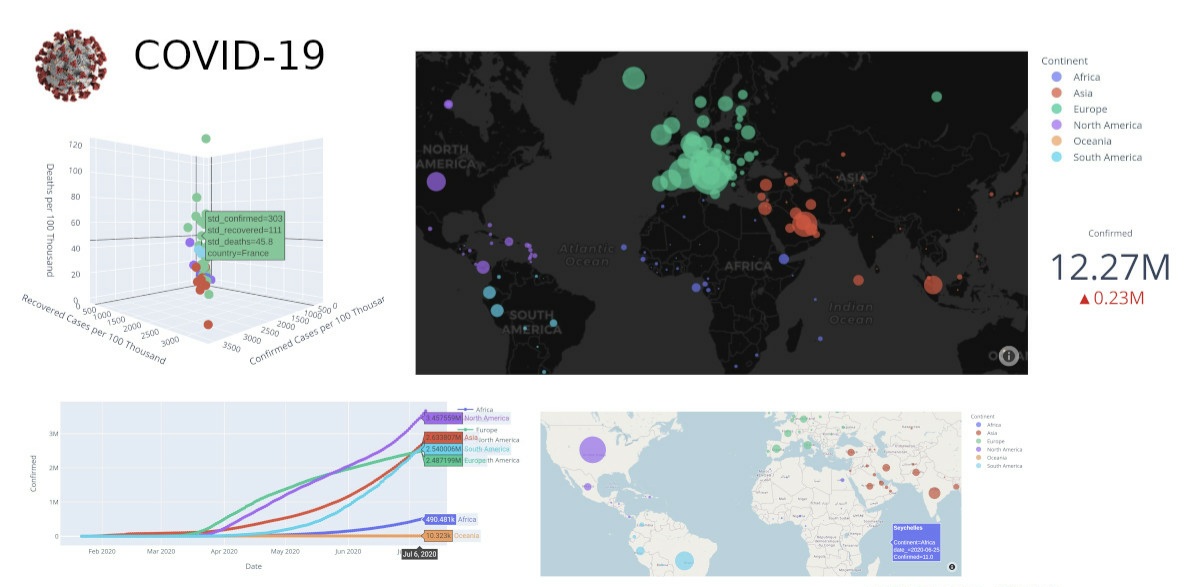
Demo: COVID-19 Visualizations.
Source Code: GitHub